Methodology
siderRETRO uses NGS (Next Generation Sequencing) data to identify unfixed - dimorphic/polymorphic, germinative, or somatic - retrocopies absent in the reference genome, but present in the sequenced genome (by NGS).
Our methodology consists of detecting abnormal (discordant) alignments in SAM/BAM/CRAM file and, with an unsupervised machine learning algorithm, clustering these reads and genotype in order to discover somatic retrocopy insertions. Care is taken to ensure the quality and consistency of the data, taking into account the features that characterize a retrocopy mobilization, such as the absence of intronic and regulatory regions.
Note
For more detail about the jargon, see Retrocopy in a nutshell
Abnormal alignment
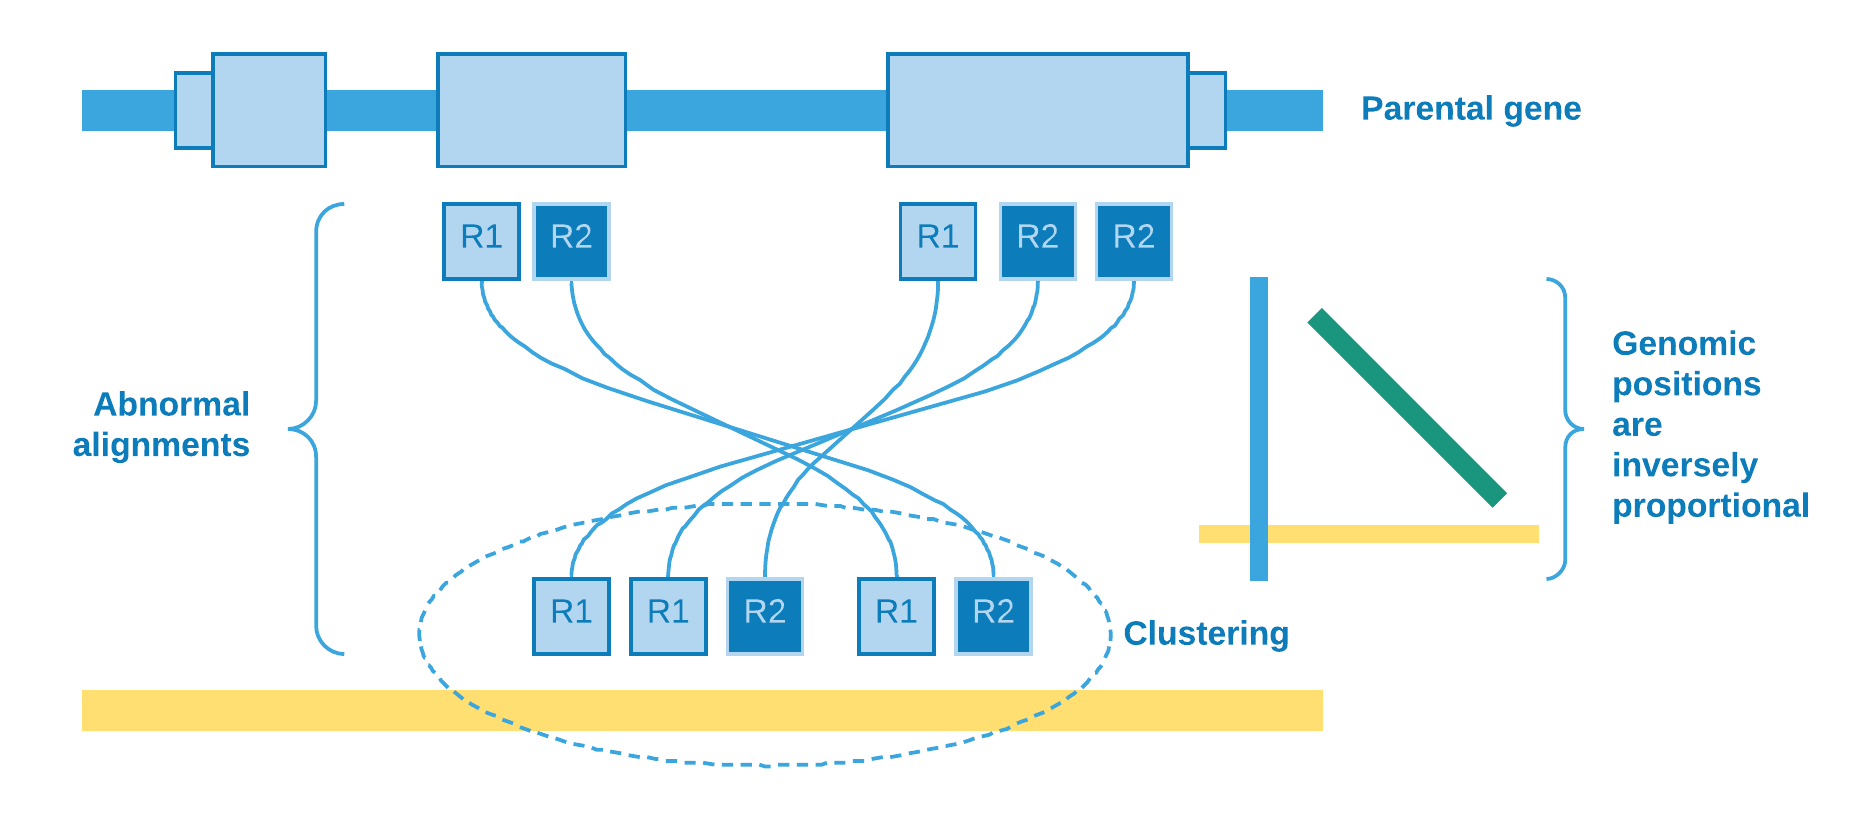
When a structural variation, such as a retrotransposition, occurs into an individual and her genome is sequenced with a next-generation sequencing technology (e.g. illumina), we may expect that the aligner (e.g. BWA, Bowtie) will be confused as to the origin of certain reads. As the retrocopies come from a mature mRNA, reads from the retrocopy may be erroneously aligned to an exon of the parental gene:
These kind of alignment may be called indistinguishable, because they do not give any clue about the presence of the retrocopy. However, for our luck, there are reads with abnormal (discordant) alignments which could be helpful according to their characteristics:
Paired-end reads aligned at different exons
Paired-end reads aligned at different chromosomes
Paired-end reads aligned at distant regions
Splitted reads (Reads with supplementary alignment)
We will talk about each one as best as we can in the next lines.
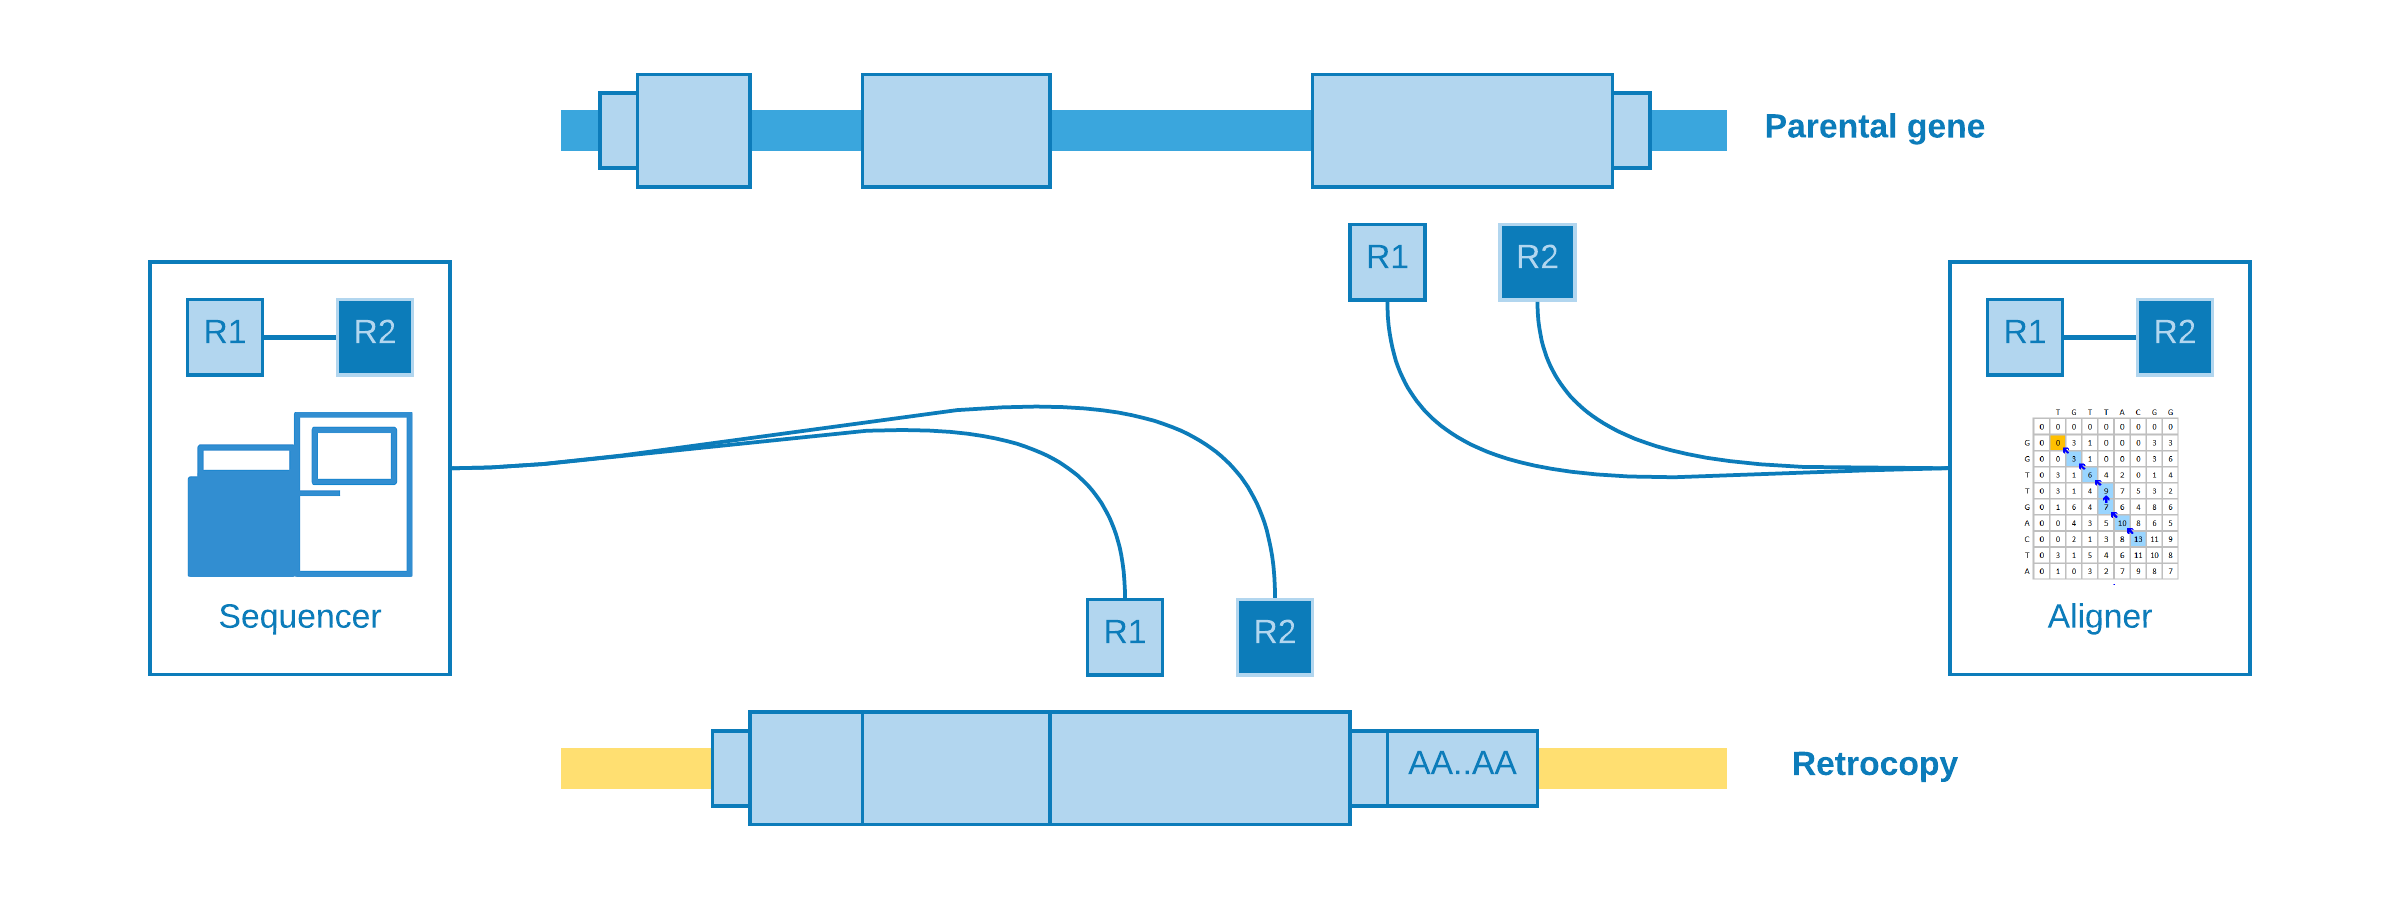
Alignment at different exons
When paired-end reads are mapped to contiguous exons and they came from a genomic sequencing - which of course is not expected.
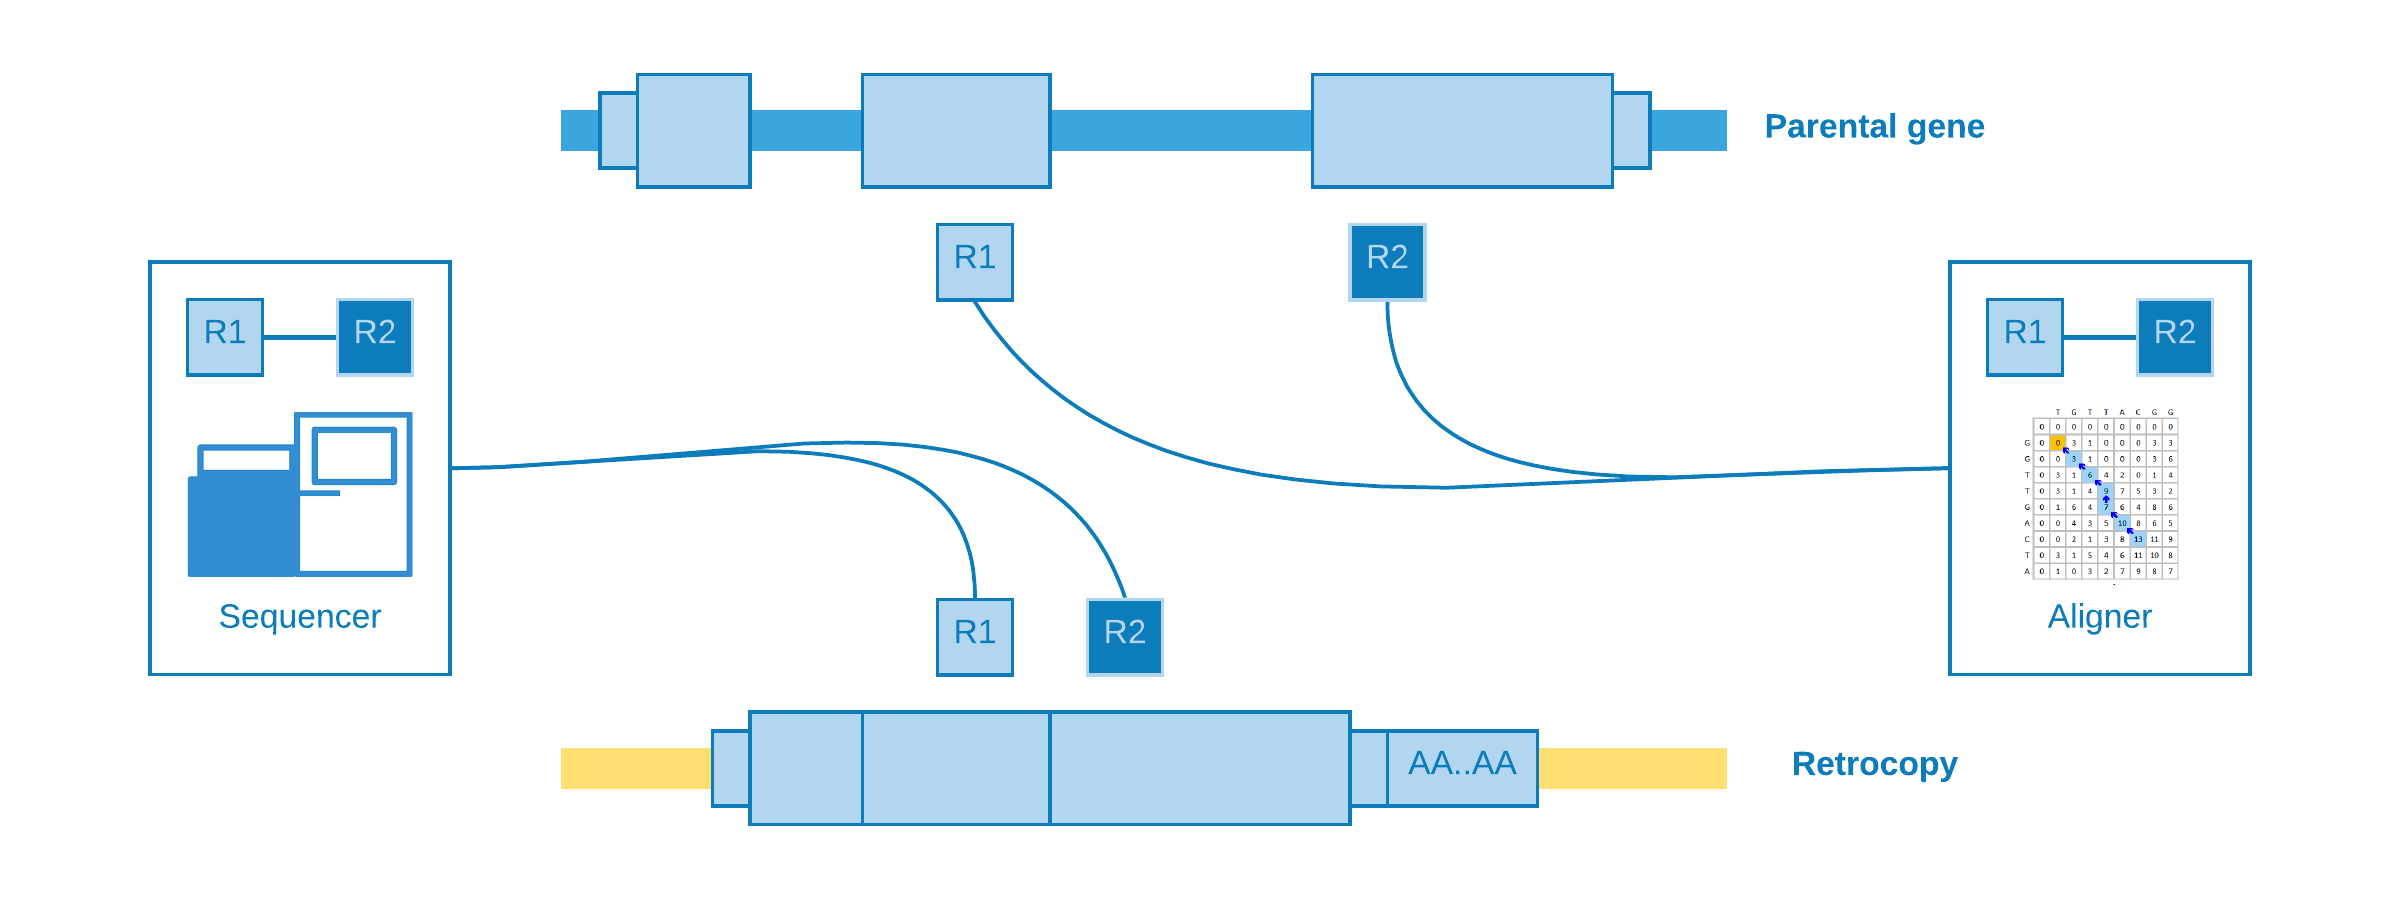
This kind of alignment is useful for assume a retrotransposition for the given parental gene, however it is not possible to annotate the genomic position of the event.
Alignment at different chromosomes
When the retrotransposition does not occur into the same parental gene chromosome, it may happen that one read come from a near intergenic region and its pair from the somatic retrocopy. As the retrocopy does not exist in the reference genome, the aligner will map one read to the retrotransposition chromosome and its pair to the parental gene exon.
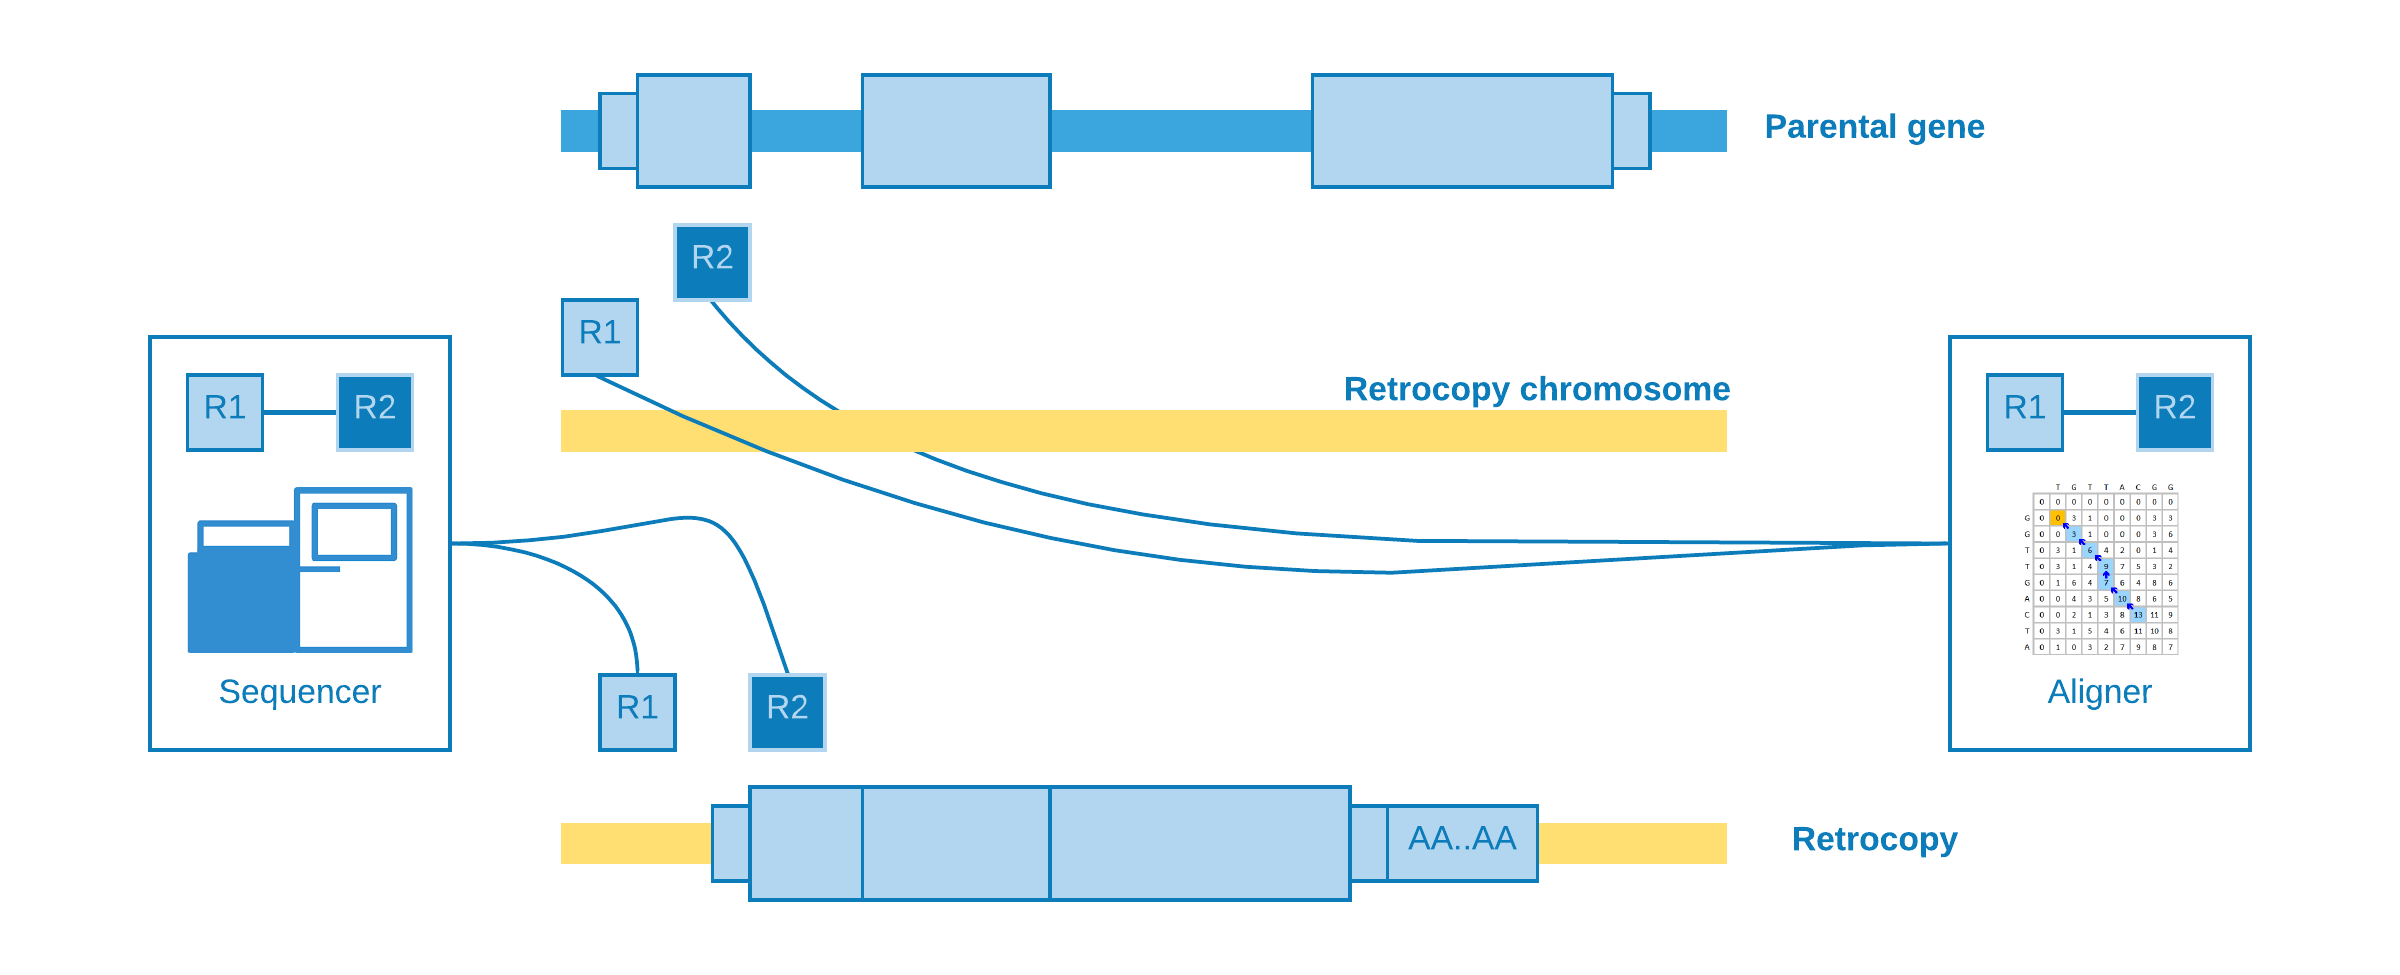
This alignment is useful to estimate the genomic position of the event, but not with so much precision concerning to the insertion point.
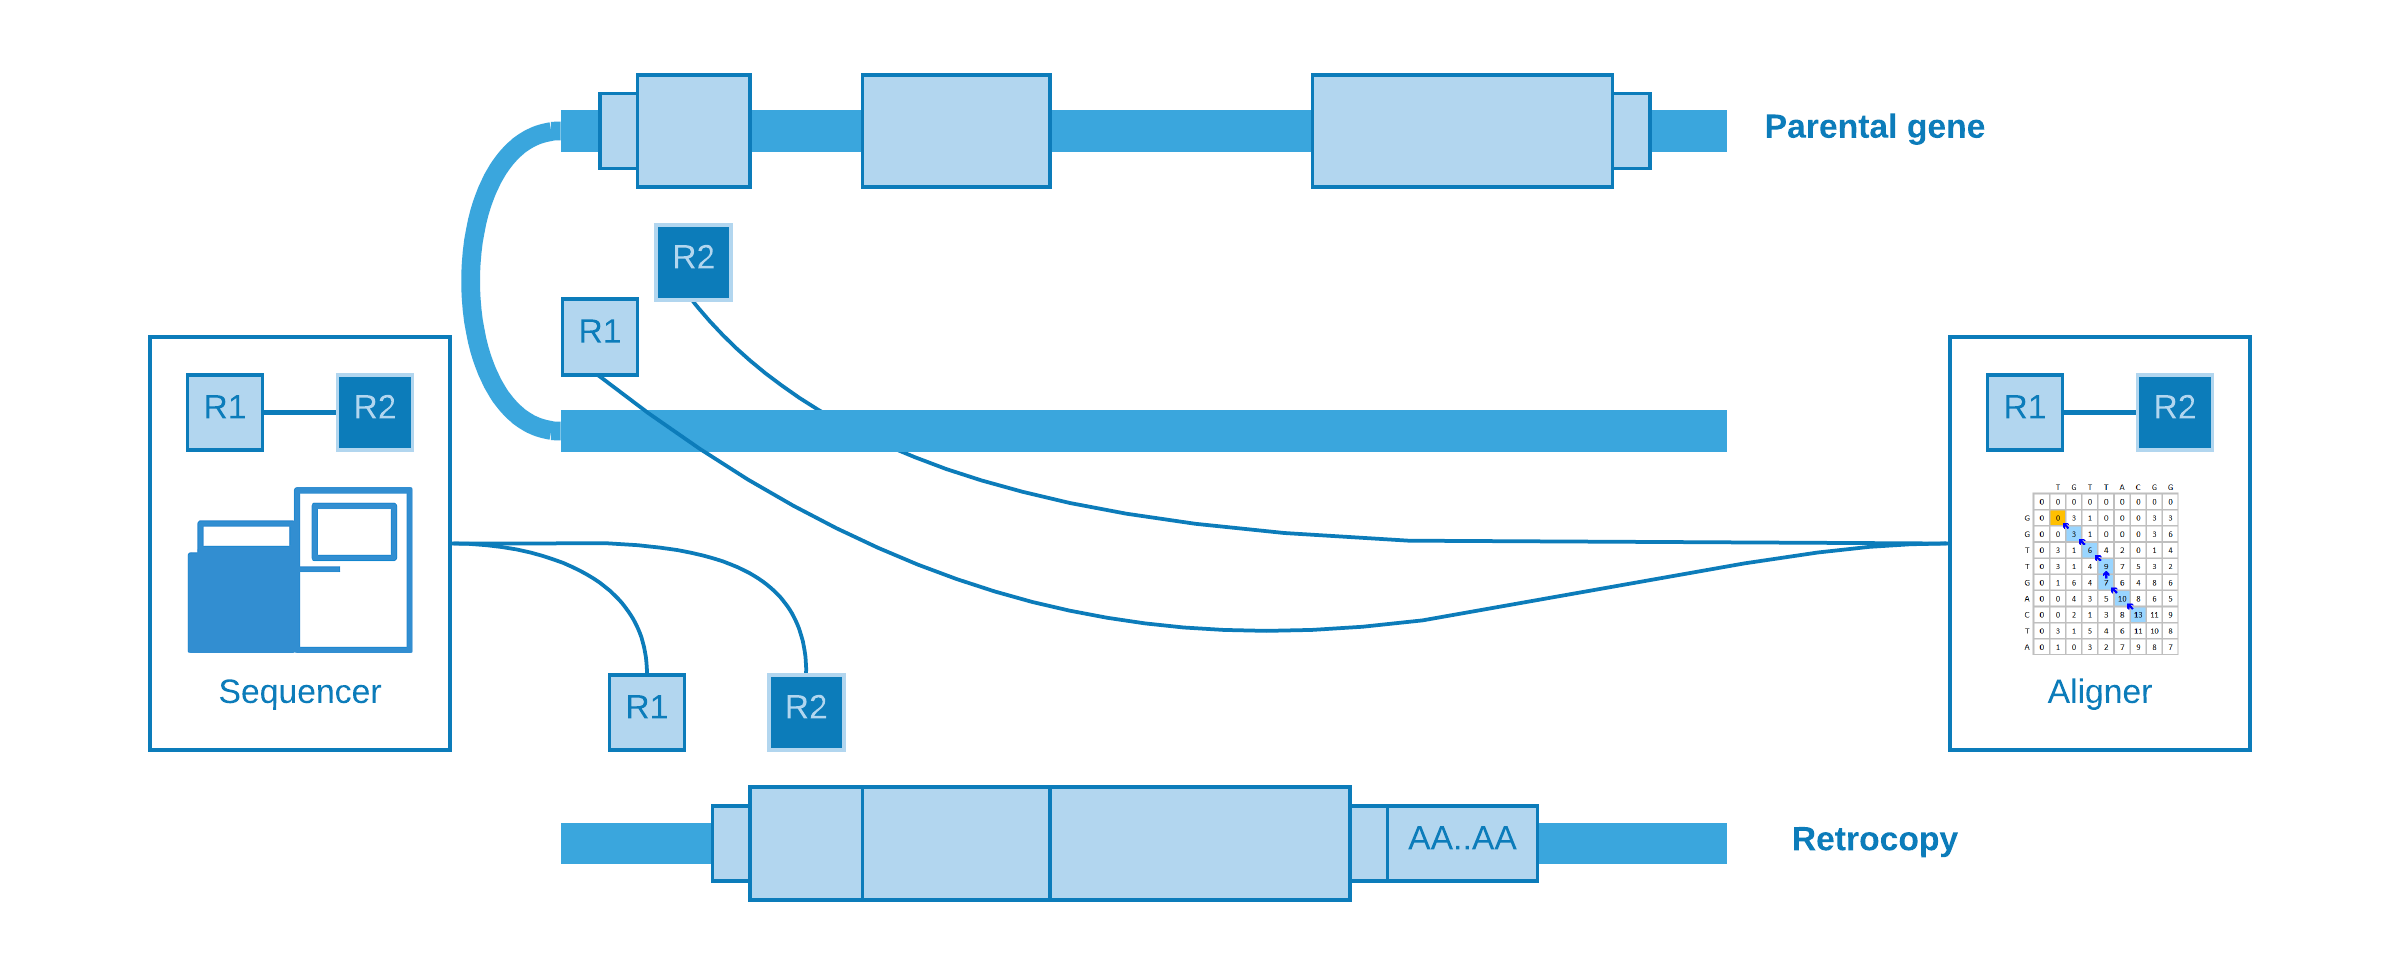
Alignment at distant regions
If a retrocopy is inserted into the same chromosome of its parental gene, possibly it will occur at a distant location. As well as “alignment at different chromosomes”, one read may come from a near intergenic region and its mate from the somatic retrocopy. So when the aligner try to map these reads, we will observe that one fall inside the parental gene exon, while its pair is mapped to a distant region.
Splitted reads
The most important kind of alignment when detecting structural variations. The splitted read may occur when part of the same read come from a near intergenic region and part from the somatic retrocopy. When the aligner try to map the read, it will need to create another one to represent the splitted part, which is called supplementary.
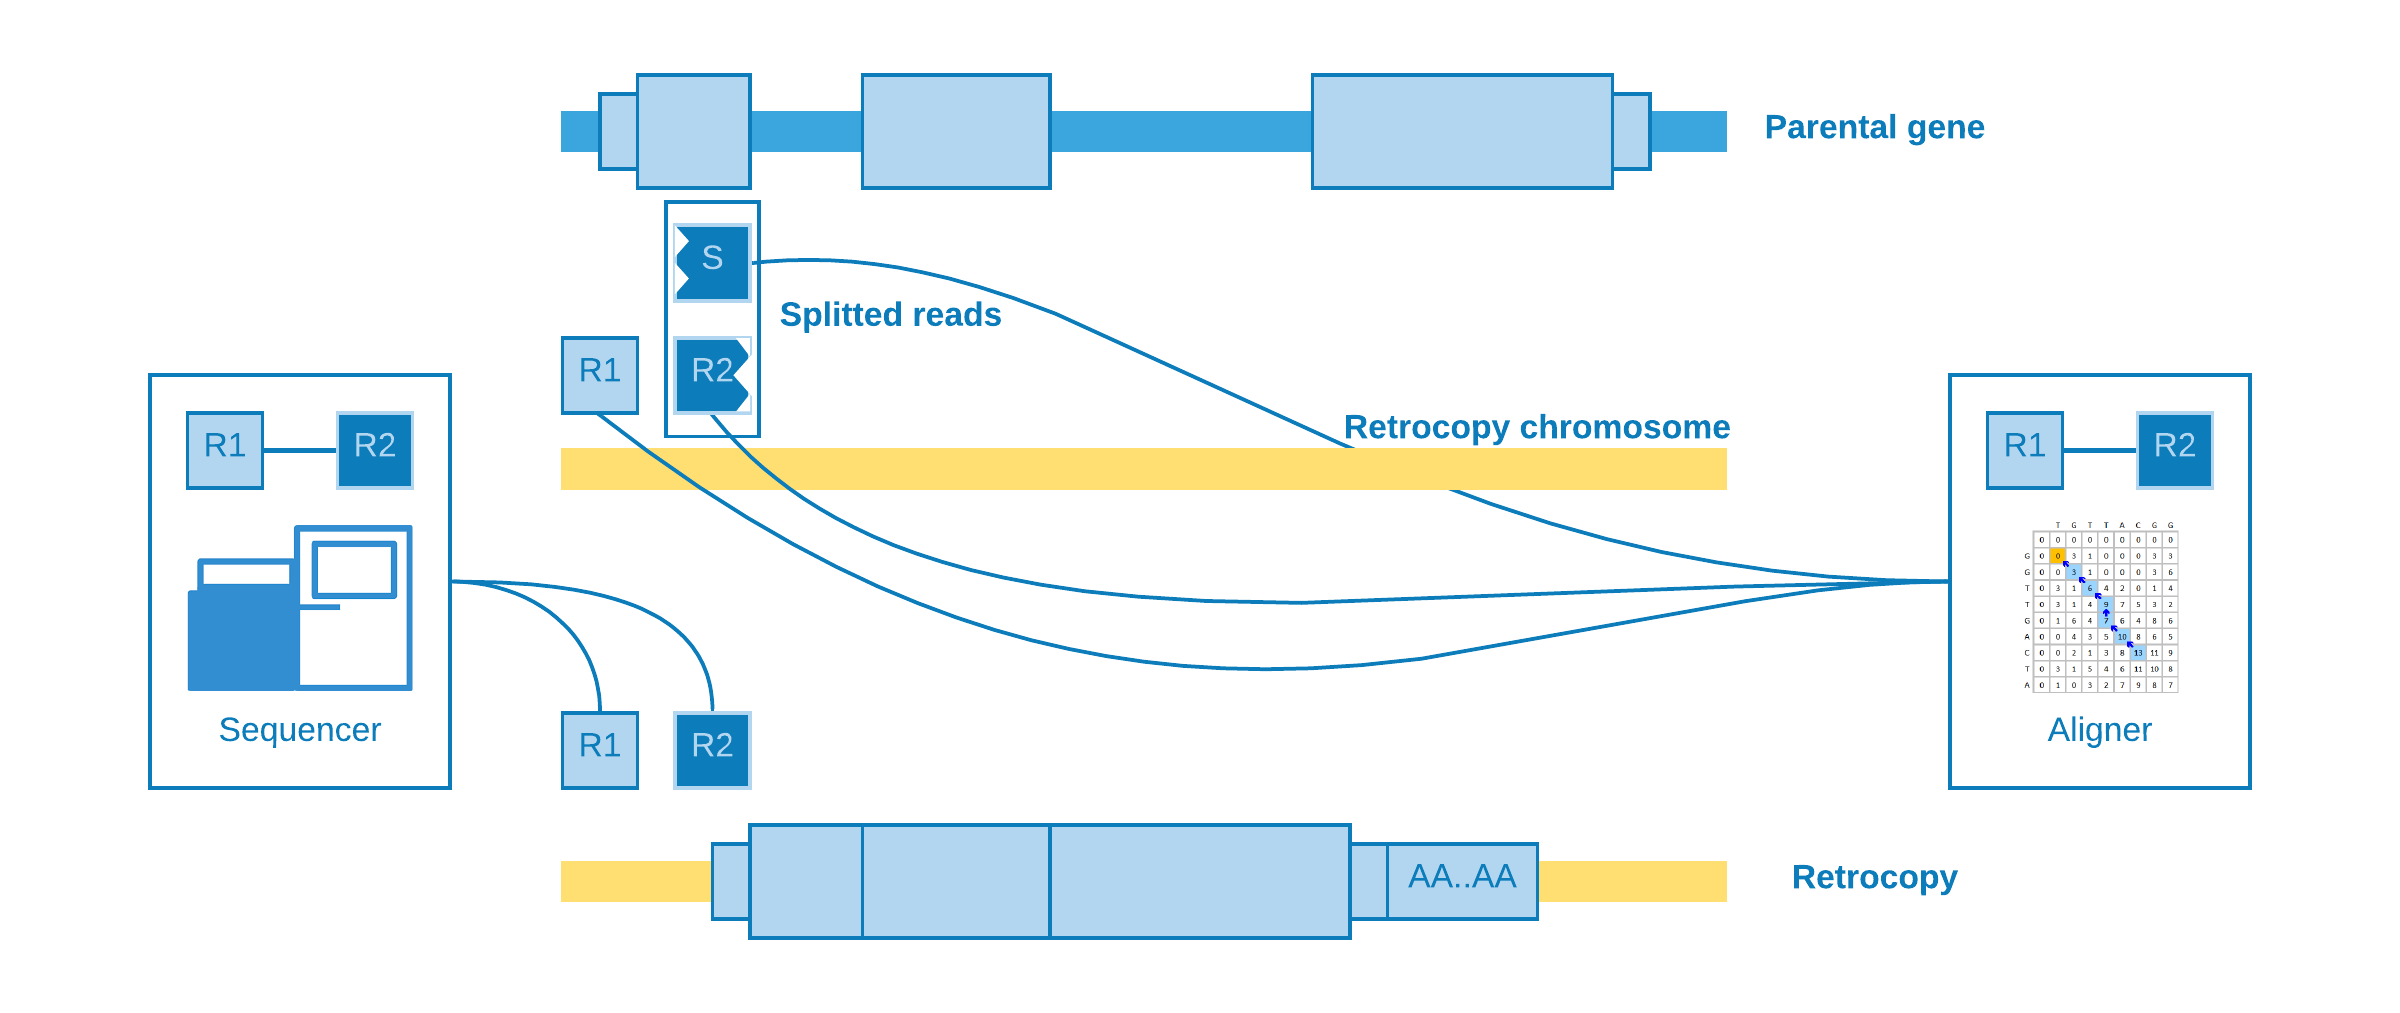
This alignment is useful to detect the insertion point with a good precision.
Taking all together
We can resume all abnormal alignments according to their power to detect the retrotransposition coordinate and its exact insertion point:
Abnormal alignments |
Coordinate |
Insertion point |
|---|---|---|
At different exons |
NO |
NO |
At different chromosomes |
YES |
NO |
At distant regions |
YES |
NO |
Splitted read |
YES |
YES |
sideRETRO uses only the abnormal alignments capable to detect at least the coordinate, so those that fall into different exons are dismissed.
Clustering
So far we have been talking about abnormal reads selection. As soon as this step is over, we need to determine if a bunch of reads aligned to some genomic region may represent a putative retrocopy insertion. Therefore, firstly we restrict the abnormal reads for those whose mate is mapped to a protein coding exon, and then we cluster them according to the chromosome they mapped to.
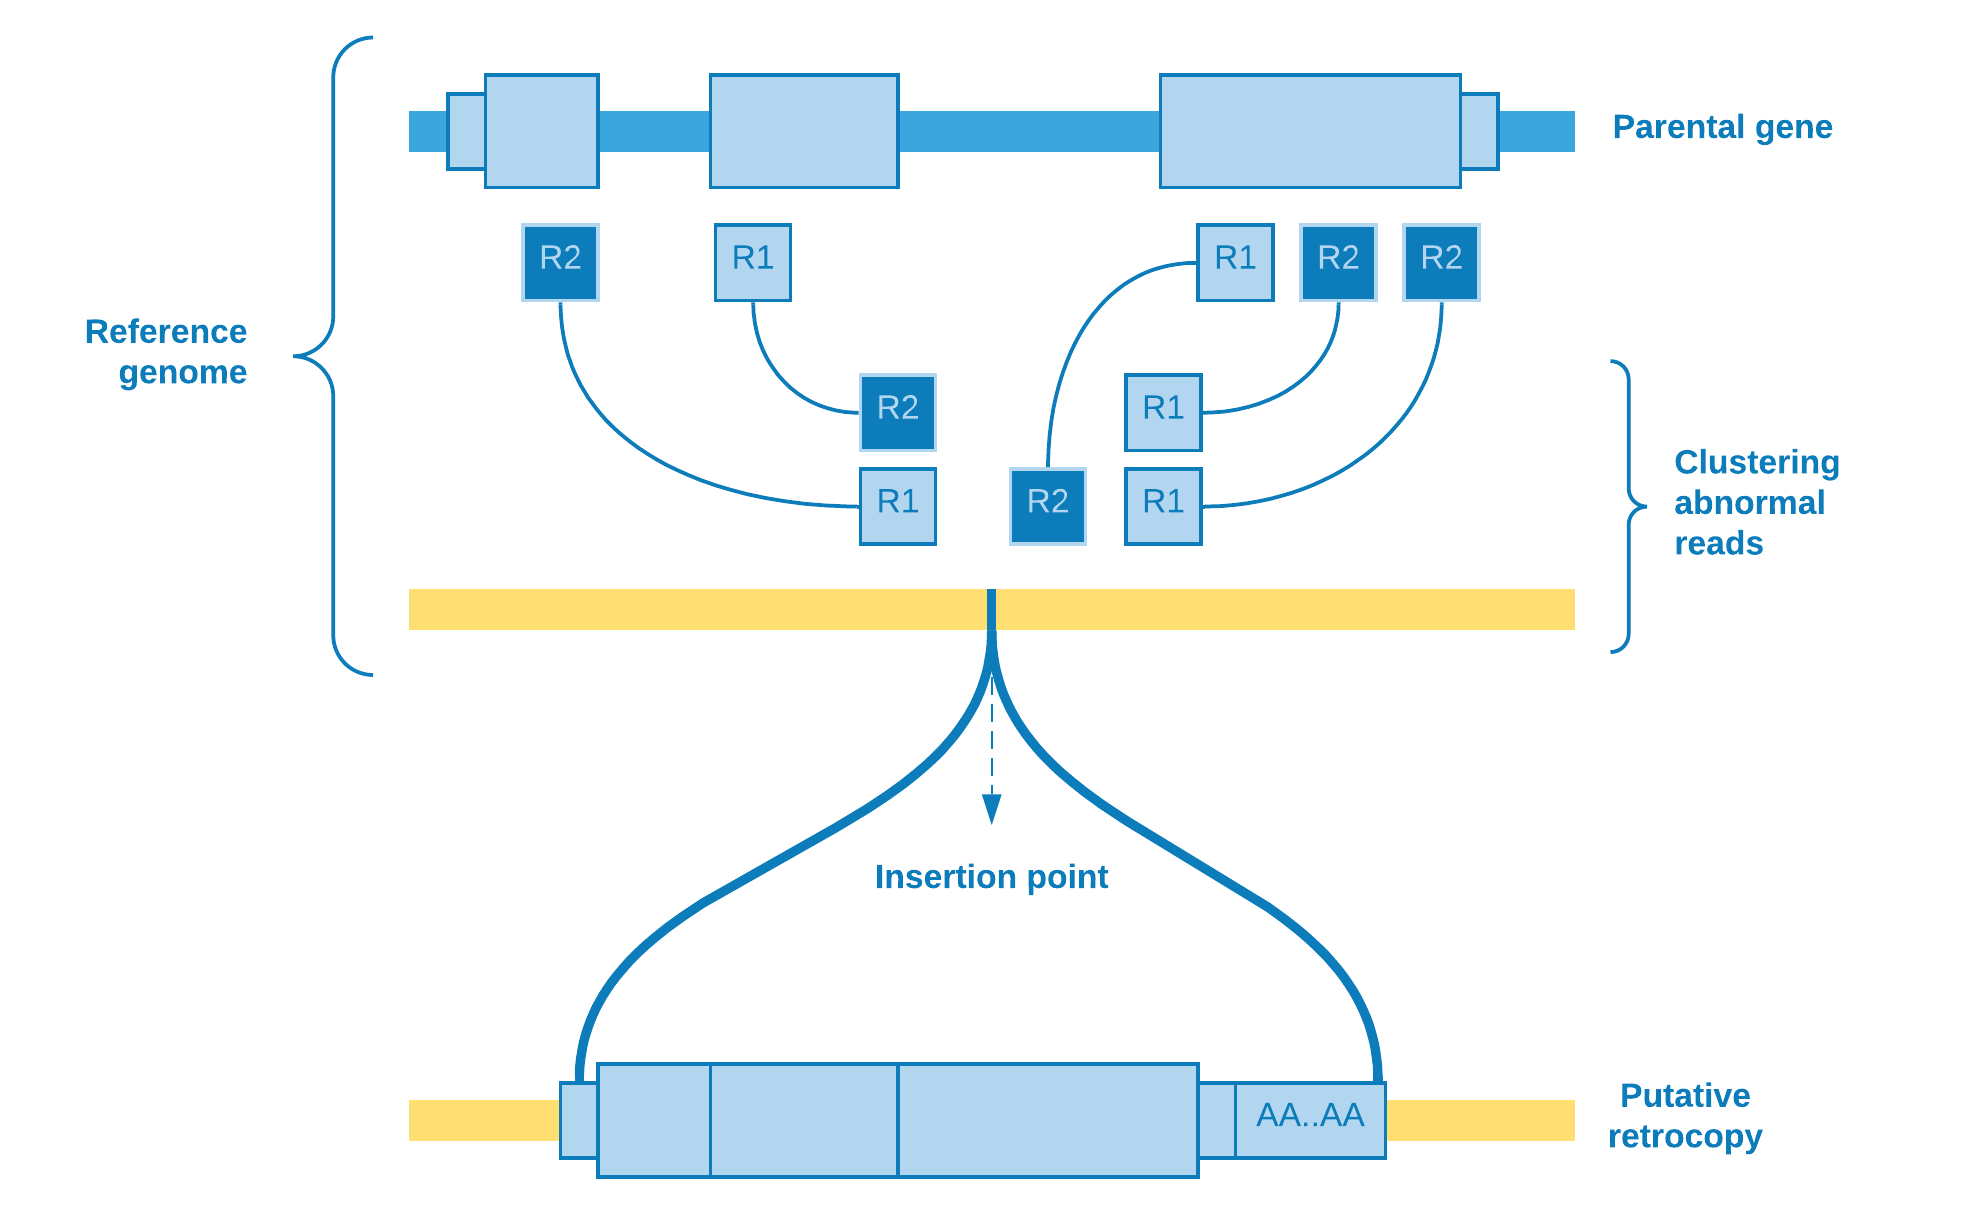
Wherefore, the clustering algorithm plays the role to resolve if there really is a retrotransposition event. As the number of reads covering the group is an important feature to take into account, one possible choice of algorithm is DBSCAN.
DBSCAN
Density Based Spatial Clustering of Applications with Noise [1] is a density based clustering algorithm designed to discover cluster in a spatial database. In our particular case, the database is spatially of one dimension (the chromosome extension) and the points are represented by the range comprising the mapped reads start and end.
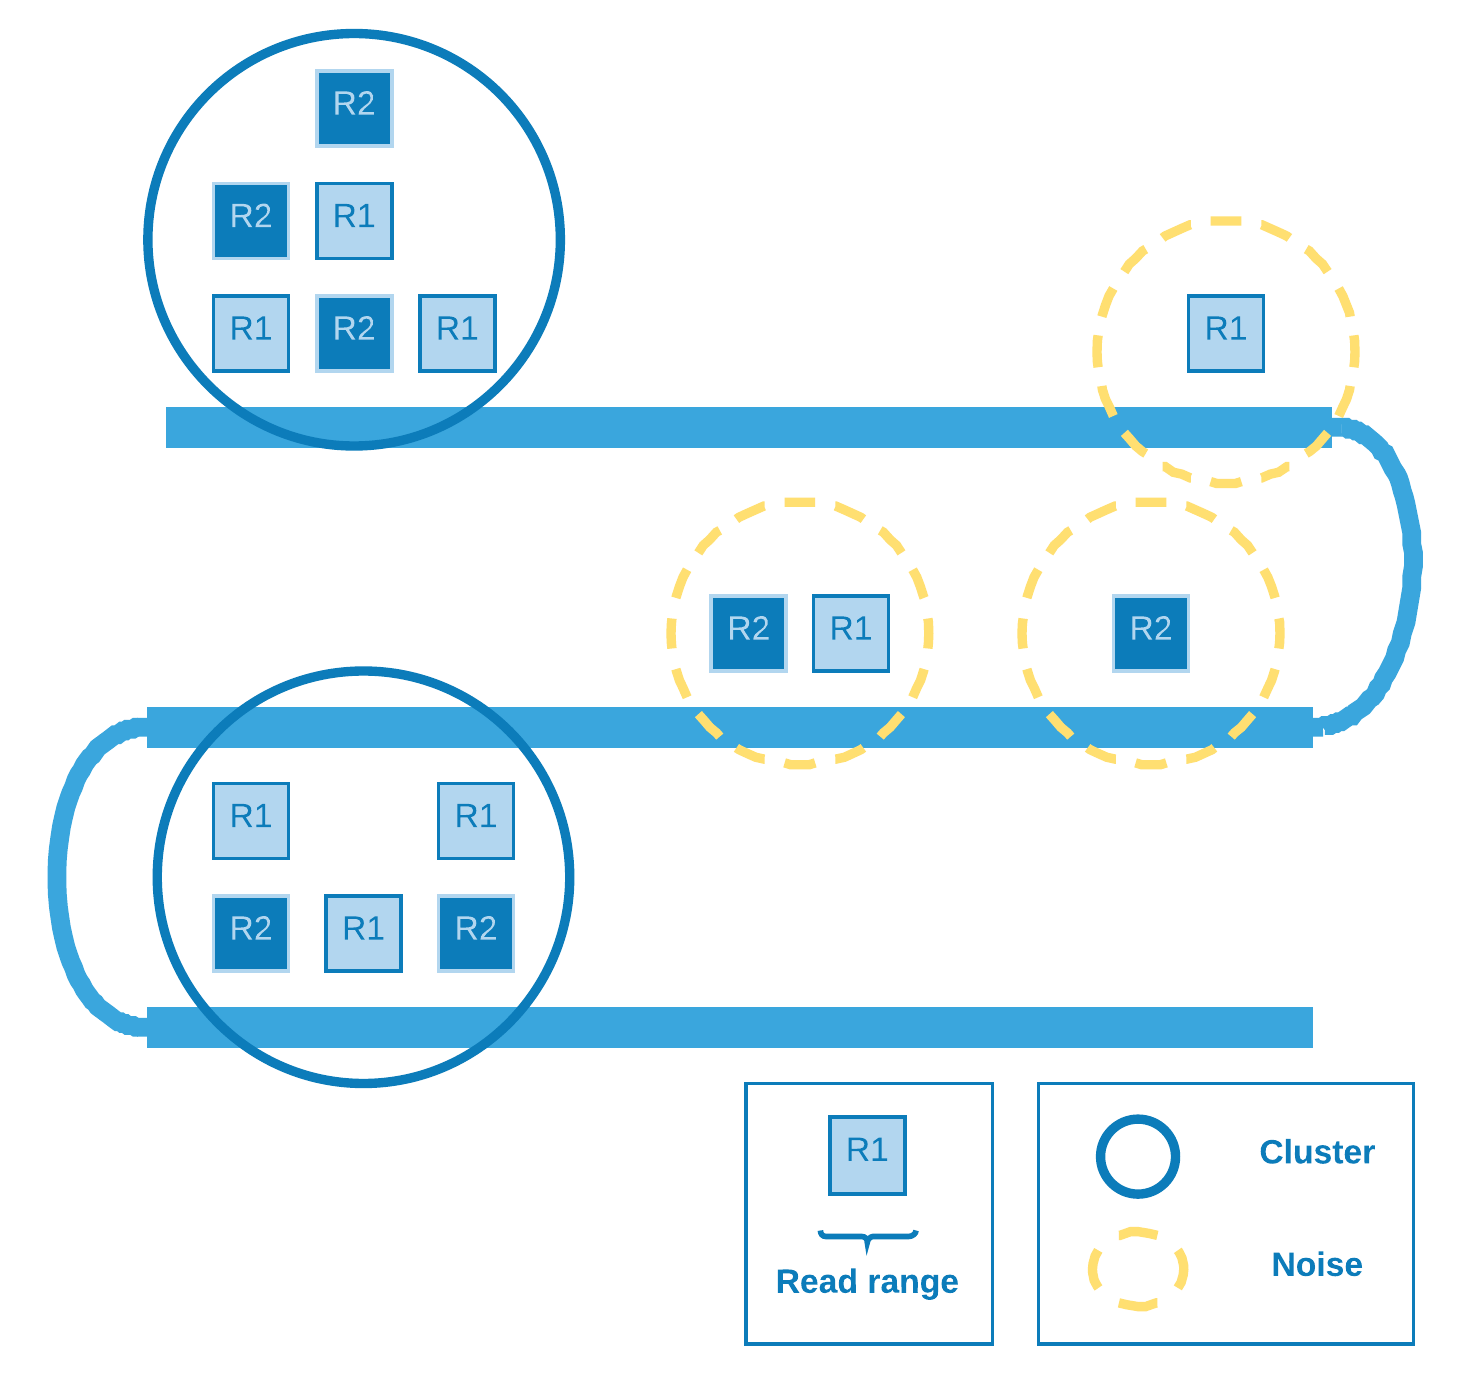
The denser (covered) the region the greater the chance of a retrotransposition event there.
Genotype
In order to increase the putative insertion coverage, it is common to join analysis of a bunch of individuals. After the discovery of the retrocopies, it is necessary to identify who owns the variation and with what zygosity ((heterozygous, homozygous). So we have three possibilities for biallelic sites [2]: If A is the reference allele and B is the alternate allele, the ordering of genotypes for the likelihoods is AA, AB, BB. The likelihoods in turn is calculated based on Heng Li paper [3] with some assumptions that we are going to discuss.
Suppose at a given retrotransposition insertion point site there are k reads. Let the first l reads identical to the reference genome and the rest be different. The unphred alignment error probability of the j-th read is \(\epsilon_{j}\). Assuming error independence, we can derive that:
where:
\(\delta(g)\) |
Likelihoods for a given genotype |
\(m\) |
Ploidy |
\(g\) |
Genotype (the number of reference alleles) |
Note
The way we are modeling the likelihoods probability differs a little bit from the SNP calling model: We are treating the read as the unit, not the base, therefore the error (\(\epsilon\)) is the mapping quality (fifth column of SAM file), instead of the sequencing quality.
So we can summarize the formula for homozygous reference (HOR), heterozygous (HET) and homozygous alternate (HOA):
- HOR
- \[\delta(HOR) = \frac{1}{2^k} \prod_{j=1}^{l} 2(1-\epsilon_{j}) \prod_{j=l+1}^{k} 2\epsilon_{j}\]
- HET
- \[\delta(HET) = \frac{1}{2^k}\]
- HOA
- \[\delta(HOA) = \frac{1}{2^k} \prod_{j=1}^{l} 2\epsilon_{j} \prod_{j=l+1}^{k} 2(1-\epsilon_{j})\]
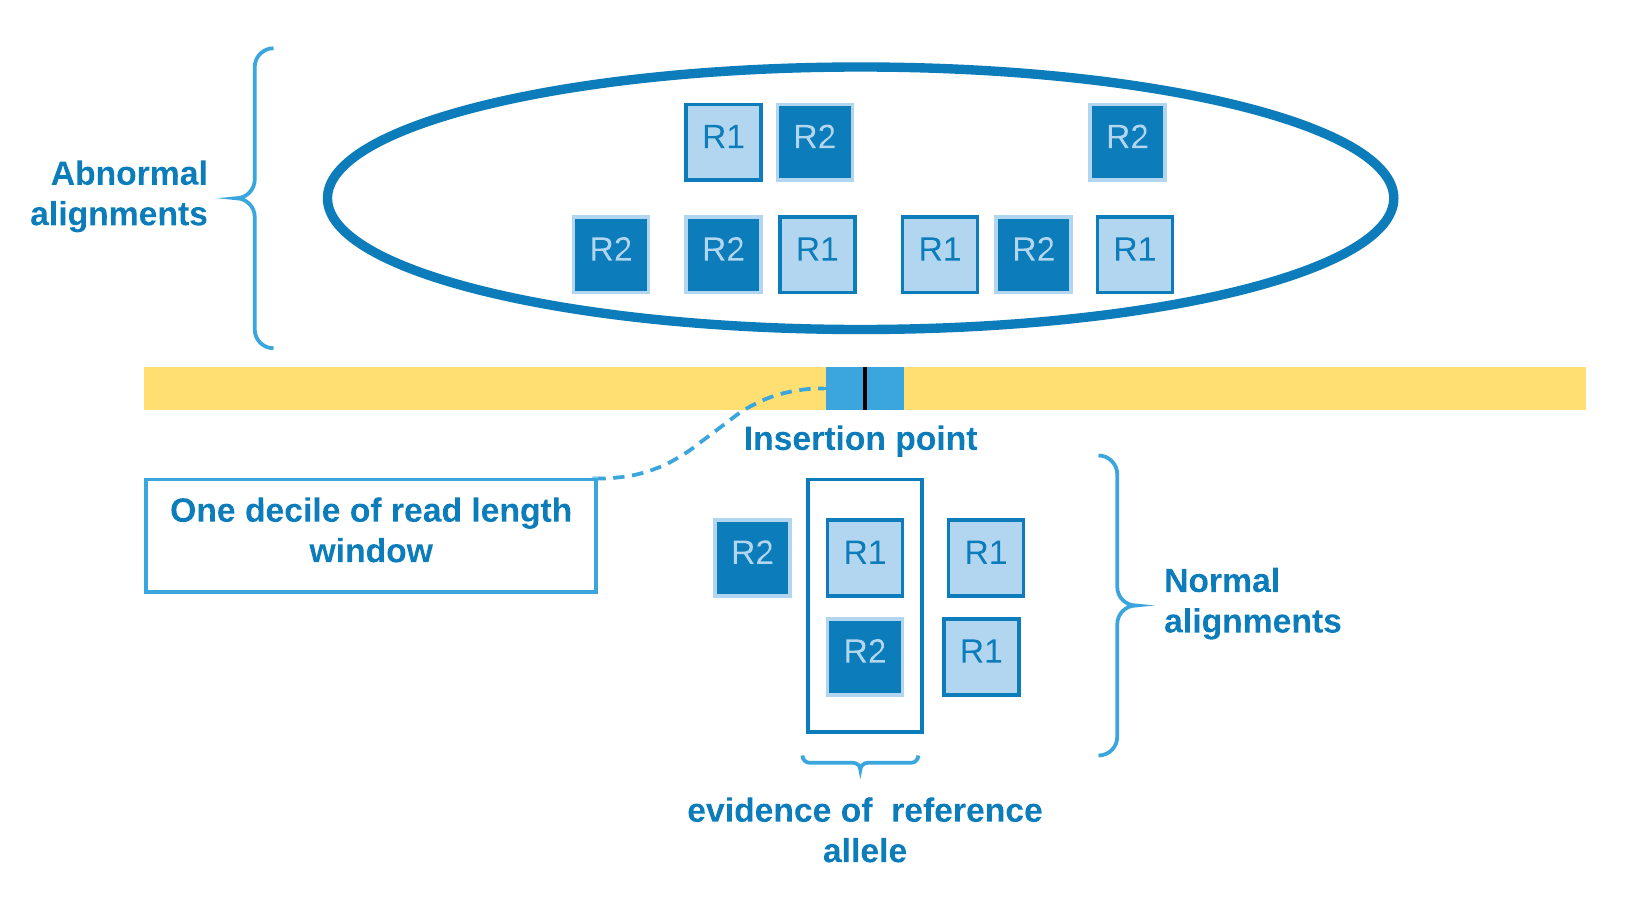
We determine the insertion point site according to the abnormal alignments clustering. Those reads will be used as the \(k - l\) rest of the reads which differs from reference genome. In order to verify if there is evidence of reference allele, we need to come back to the SAM file and check for the presence of reads crossing the insertion point. To mitigate alignment error - which would otherwise overestimate the number of reference allele reads - we select the reads that cover one decile of read length window containing the insertion point. Then we come to the \(l\) reads identical to the reference genome and can calculate the genotype likelihoods.
Orientation
Other important information that can be obtained from the data is the retrocopy orientation in relation to its parental gene. The abnormal alignment reads give us the clue to solve this issue. We catch reads when one pair aligns against an exon and its mate aligns to some genomic region, so we can sort the reads from the exonic site and analyze if their mates will be sorted in ascending or descending order as result. If we observe that they are directly proportional, then we can assume that the retrocopy is at the same parental gene strand, else they are at opposite strands.
Warning
This approach disregards the fact that there may have been structural variations, such as chromosomal inversions, which may invalidate these results.
Therefore summarizing:
Retrocopy and its parental gene are at the same strand

Retrocopy and its parental gene are at opposite strands
Spearman’s rank correlation coefficient
We use Spearman’s rank correlation coefficient [4] in order to have a measure of relationship between reads from exon and their mates from clustering site. As our data is nonparametric, the Spearman’s rho can assess monotonic relationship, that is, it can tell us if the genomic position of reads from exon increases when does the genomic position of their mates from clustering site (positive rho) - or the opposite (negative rho).
So we come to the following proposition:
Parental gene strand |
Retrocopy strand |
|
|---|---|---|
rho > 0 |
rho < 0 |
|
+ |
+ |
- |
- |
- |
+ |